What is the Gold‑Silver Ratio
The Gold‑Silver Ratio (GSR) expresses how many ounces of silver equal — in price — one ounce of gold. In practice, you compute it by dividing the current spot price of gold by the current spot price of silver:
Gold‑Silver Ratio (GSR) = Price per oz of Gold ÷ Price per oz of Silver
For example: if gold trades at $2,000/oz and silver at $25/oz, the ratio is 80:1. That means you’d need 80 ounces of silver to “buy” one ounce of gold at current prices. (SpotMarketCap)
Put simply: a higher ratio means gold is expensive relative to silver (i.e. silver is “cheap” vs. gold), a lower ratio means silver is relatively expensive vs. gold. (SpotMarketCap)
What Does the Ratio Mean — Intuitively & Practically
The GSR is a relative value indicator. It doesn’t tell you whether gold or silver is “cheap in absolute terms,” but rather whether silver is cheap or expensive relative to gold.
- When the ratio is very high, that suggests silver may be undervalued compared to gold — or gold overvalued compared to silver.
- When the ratio is very low, it suggests silver may be overvalued (or gold undervalued).
Because gold and silver often respond differently to economic forces (safe‑haven demand, industrial demand, monetary policy, etc.), the ratio gives insight into market sentiment, inflation expectations, industrial demand, risk appetite — aspects that a single‑metal price might not capture. (royalmint.com)
How You Can Use It – Investment Applications
As an investor (or advisor), the GSR can be used in various ways:
- Relative valuation / timing indicator: If GSR is unusually high vs. historical norms → consider buying silver (or silver-heavy) while underweighting gold. Conversely, when GSR is very low → silver may be “rich,” gold may be relatively attractive.
- Portfolio allocation / diversification: Depending on macro conditions (inflation, industrial demand, economic cycles), adjust the proportion of gold vs. silver holdings.
- Spread trades or ratio trades: More active investors or traders may long one metal and short the other (or use futures/derivatives), betting on a “reversion” of the ratio toward some long-term mean. (CU Denver Business School)
- Hedging / macro strategy: Because silver has industrial demand (unlike gold), a skew toward silver may act like a hybrid inflation‑/industrial‑demand play; gold may be more of a safe‑haven / monetary‑value play.
It’s important, however, not to use the GSR as the only criterion. Both metals have their own fundamental drivers (industrial demand, mining supply, monetary flows, investor sentiment). The GSR is a relative tool — valuable to suggest when one metal may be “cheaper than usual” vs. the other. (usmoneyreserve.com)
What the Gold‑Silver Ratio Tells You (and What It Doesn’t)
What it does tell you:
- The relative value between gold and silver at a glance.
- Market sentiment and relative demand: a rising ratio often signals investors flocking to gold (safe‑haven, inflation hedge), perhaps at the expense of silver (industrial / risk metal), or a slump in silver demand. (CU Denver Business School)
- Historically “extreme” valuations — i.e. when to pay attention for potential turning points or opportunities.
What it does not tell you:
- It doesn’t tell if gold or silver are “cheap” or “expensive” in absolute terms (i.e. relative to inflation, real interest rates, or other asset classes).
- It doesn’t predict short‑term price moves reliably — metals are volatile, and many factors (industrial demand, mining supply, monetary policy, geopolitics) affect each metal separately.
- It doesn’t guarantee a “reversion” to any historical mean; sometimes the “normal” range may shift over time, under new structural realities (e.g. changed supply/demand dynamics, shifts from industrial to investment demand, changes in monetary policy).
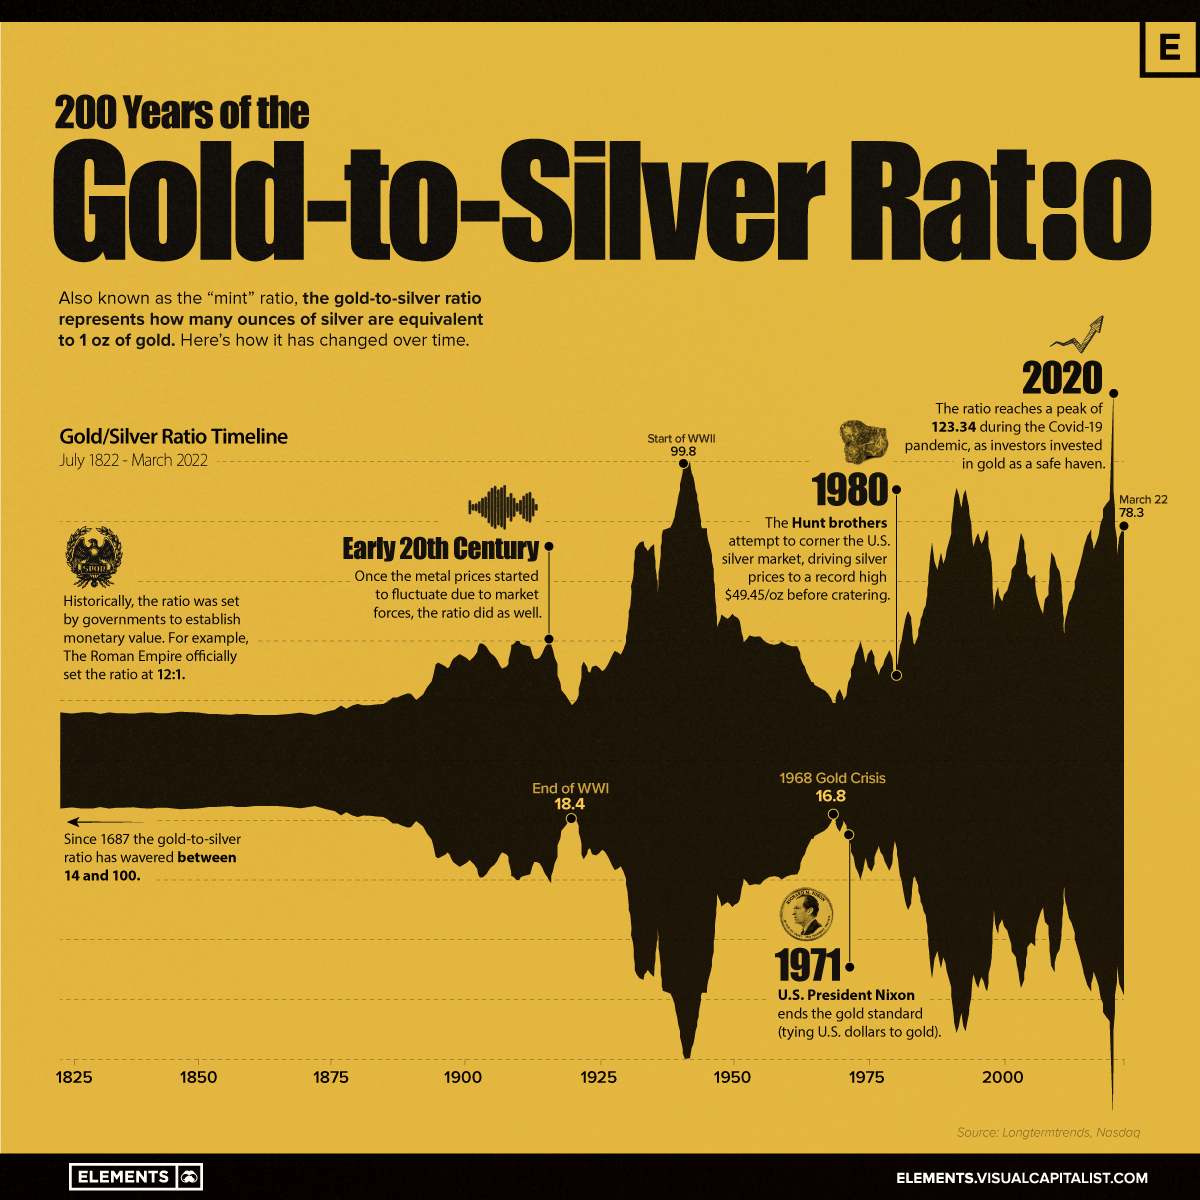
Historical Gold‑Silver Ratio: Key Milestones and What They Tell Us
| Period / Event | Ratio (approx) / Range | Significance / Notes |
|---|---|---|
| Ancient / Classical times | ~ 8–13:1 (e.g. Roman Empire set ratio ~12:1) (Gold Silver Ratio (GSR)) | Metals used as money; ratio fixed by government/mint. Reflects perceived scarcity/abundance. |
| 1792 (U.S. Coinage Act) & early modern coinage | 15:1 (later ~16:1) (royalmint.com) | Official “mint ratio” — gold and silver used as bimetallic currency standard. |
| Early–mid 20th century (pre‑1971) | Generally 30:1 – 40:1 (USAGOLD) | The ratio was relatively stable while monetary systems still more rigid. |
| 1971 and after (end of gold standard / free market prices) | Increasing volatility; long-term “free market average” around 60–70:1. (Gold Standard) | With gold and silver priced freely, supply/demand, inflation expectations, and investor sentiment started to drive big fluctuations. |
| 1980 (Hunt Brothers silver squeeze) | As low as ~14–17:1 (Gold Standard) | Extreme silver demand / speculative mania compressed the ratio — silver temporarily nearly as “valuable” as gold in relative terms. |
| 1990s–2000s | Often in 50–60:1 range. (investing.university) | Many analysts considered this a “normal baseline” for modern times. |
| 2008 Financial Crisis | Ratio widen to ~80:1 (gold rally, silver slump) (Gold Silver Stacks) | Flight to safety, industrial slump suppressing silver demand. |
| 2011 Silver rally | Ratio compressed to ~30–40:1 (silver spiked) (bullionexpress.com) | Silver benefited from demand and speculation, narrowing the gap vs. gold again. |
| 2020 COVID‑19 market panic | All‑time modern high ~125:1 (or 123–125) (Gold Standard) | Gold surged on safe‑haven demand; silver collapsed as industrial demand froze — dramatic divergence. |
| 2021–2025 | Ratio generally between 60 and ~85, with occasional spikes (as of late 2025 around 80–85:1) (USAGOLD) | Silver regained some ground, but ratio remains above long‑term “coinage-era” norms. |
This history demonstrates that GSR has oscillated between extremes — from single‑digit mint ratios during ancient/manipulated coinage eras, to modern extremes above 100:1 — reflecting fundamentals, monetary policy, industrial demand, and investor behavior. (Gold Silver Stacks)
Why the Ratio Changed — From Mint Ratio to Market Ratio
Historically (ancient to 19th / early 20th century), the ratio was fixed by governments for coinage — to provide currency stability, monetary control, and trust in the money supply. For example, the legendary mint ratio of ~15:1 under the U.S. Coinage Act of 1792 was not driven by market forces, but by law. (royalmint.com)
With the gradual abandonment of the bimetallic standard, and especially after the end of the gold standard / free float of precious‐metal prices, market forces (supply, industrial demand, mining, central bank behavior, macroeconomic trends) began to determine the ratio. That has resulted in far greater volatility, and a ratio that often bears little resemblance to historical “mint” values. (MINING.COM)
Moreover, silver increasingly plays a dual role — not only as a “monetary/foundation metal,” but also as an industrial metal (used in electronics, solar panels, photography, etc.). That adds a dimension to the ratio that coinage-era logic didn’t account for: changes in industrial demand, technological innovation, supply chain constraints. (MINING.COM)
Investment Strategies Using the Gold‑Silver Ratio
As a “silver‑specialist investor / advisor,” here are several strategies built around the GSR — with caveats and considerations.
1. Ratio Reversion (Mean‑Reversion) Strategy
- Buy silver (or silver-heavy) when the ratio spikes high (e.g. above long-term average), expecting the ratio to revert downward (silver catching up / outperforming gold).
- Conversely, buy gold (or overweight gold) when the ratio collapses — silver may be overheated, gold relatively cheap.
Pros: Simple logic; historically such swings have corrected (though not always quickly).
Cons: No guarantee ratio will revert — structural changes (industrial demand, monetary policy) may shift the “normal.”
2. Diversified Precious Metals Portfolio
Maintain a diversified allocation to both metals; adjust ratio of gold:silver depending on macro outlook:
- In uncertain macro environment (inflation, geopolitical risk), overweight gold.
- In economic recovery / industrial boom, increase silver allocation — benefit from both industrial demand and potential ratio reversion.
3. Spread Trades / Arbitrage (for Advanced / Active Investors)
Engage in “long silver / short gold” (or vice versa) using futures, ETFs, or derivatives — hoping to profit from changes in the ratio rather than absolute moves in each metal. This can be used as a hedge against broader market risk. (CU Denver Business School)
4. Tactical Accumulation / Dollar‑Cost Averaging with Ratio Awareness
For long‑term investors (stackers): accumulate silver gradually when the ratio is elevated; add gold when ratio is depressed. Over time, this smooths entry points and captures favorable relative valuations.
Important caveat: Always consider storage, liquidity, cost of bullion, and diversification outside precious metals. The ratio should be only one input into a broader investment thesis.
What the Gold‑Silver Ratio is Not — And Common Misconceptions
- The GSR is not a prophecy — it does not guarantee silver will soar if ratio is high. Markets evolve; structural changes (mining supply, demand, technology, monetary policy) may alter the baseline.
- The ratio does not replace thorough research on fundamentals (mining supply/demand, fiscal/monetary conditions, industrial demand cycles).
- Don’t treat silver simply as “mini-gold.” Silver’s dual role (precious + industrial metal) means its price behavior can diverge significantly from gold.
Some commentators argue that post‑1970s, the GSR’s relevance has diminished because gold and silver are driven by different demand vectors; so a “gold‑only” or “silver‑only” thesis may be more appropriate depending on individual fundamentals. (usmoneyreserve.com)
Geological / Natural‑Abundance Ratio: What Earth’s Composition Suggests
To get a sense of “how abundant silver is vs. gold in nature,” some analysts refer to the approximate ratio of silver to gold in the Earth’s crust. Estimates often point to something like ~ 15–17.5 parts silver to 1 part gold. (Gold Standard)
If markets corresponded strictly to geological scarcity / abundance, one might expect a “natural” GSR around 15–17:1 — similar to historical mint ratios. The fact that modern market ratios often sit at 50:1, 80:1, 100:1 or more underscores how far away markets are from “natural abundance pricing.”
This divergence reflects a broad set of modern influences: monetary policy, speculative demand, industrial demand (especially for silver), supply economics, and investor psychology.
Future Outlook & What Could Shape the Gold‑Silver Ratio Ahead
While nobody can predict the future with certainty, several factors could influence future behavior of the GSR:
- Industrial demand for silver: As technology advances (renewables, electronics, photovoltaics, EVs, green tech), demand for silver could increase, putting upward pressure on silver price and compressing the ratio.
- Monetary / macroeconomic environment: Inflation, currency devaluation, interest rate changes, and fiscal policy could drive gold demand — pushing the ratio higher.
- Mining supply constraints / recycling trends: Silver is often a by-product of base‑metal mining (not always mined primarily for silver). If silver supply becomes constrained or mining costs rise, silver price could appreciate relative to gold.
- Changing investor sentiment / financial regulation / institutional demand: Central bank behavior, institutional allocations, ESG trends — all could shift relative demand between metals.
- Structural shift in what “normal” ratio is: It may be that the “normal” for the 21st century is different than the 20th century — perhaps a new equilibrium at 60–80:1 (or elsewhere), depending on technology, demand, and monetary policy regimes.
As a silver-specialist investor, I consider that while historical extremes (e.g. 14:1 or 125:1) are useful reference points, the combination of booming industrial demand for silver + macro uncertainty + constrained supply makes a compressed ratio (silver outperforming gold) a plausible long-term scenario — especially if economies push toward green transition, electrification, and industrial metals demand increases.
That said: one should remain diversified and pragmatic; silver remains more volatile than gold, and investing solely on a ratio view carries risks (especially if the “old normal” no longer returns).
Summary & Practical Takeaways
- The Gold‑Silver Ratio is a simple but powerful relative‑value indicator: it shows how many ounces of silver are needed to equal one ounce of gold.
- Historically, governments fixed it (mint ratio ~10–16:1), but today it floats — influenced by market forces, industrial demand, sentiment, and macroeconomics.
- The ratio offers insight into relative valuation between metals, and can help guide timing (buying silver vs. gold), allocation (diversified holdings), and strategic trades (spread trades, hedging).
- However, it is not a stand-alone tool; you always need to consider fundamentals, broader macro context, risk, and liquidity.
- Given current trends (industrial demand for silver, supply constraints, macro uncertainty), silver may offer interesting long-term potential — but with higher volatility.
- For long-term investors, a mixed approach (combining gold and silver, using GSR as one of several signals) remains the most balanced and prudent.
References & Further Reading
- “Gold-Silver Ratio Guide 1900–2025”, USAGOLD. (USAGOLD)
- “Gold/Silver Ratio History”, Investing.University. (investing.university)
- “The Gold‑Silver Ratio: Understanding the Gold‑Silver Ratio”, The Royal Mint. (royalmint.com)
- “The Gold-Silver Ratio: A Powerful Market Indicator …”, Gold‑Standard.org. (Gold Standard)
- “What is the Gold Silver Ratio?”, SpotMarketCap blog. (SpotMarketCap)
- “Gold and Silver Ratio – its history and application”, U.S. Money Reserve. (usmoneyreserve.com)
- “Charting the gold-to-silver ratio over 200 years”, Mining.com. (MINING.COM)